Pilih jalurmu
Lebih spesifik
Hello everyone! Today we are diving into Descriptive Statistics, the art of turning raw data into meaningful and useful information.
By looking at these axes and data points, we can find the center of the data. In this visual, the mean, or x bar, equals five.
Think of the concept like this: raw data is like a long, complex book. Statistics is the book summary, where we look for the average and the spread.
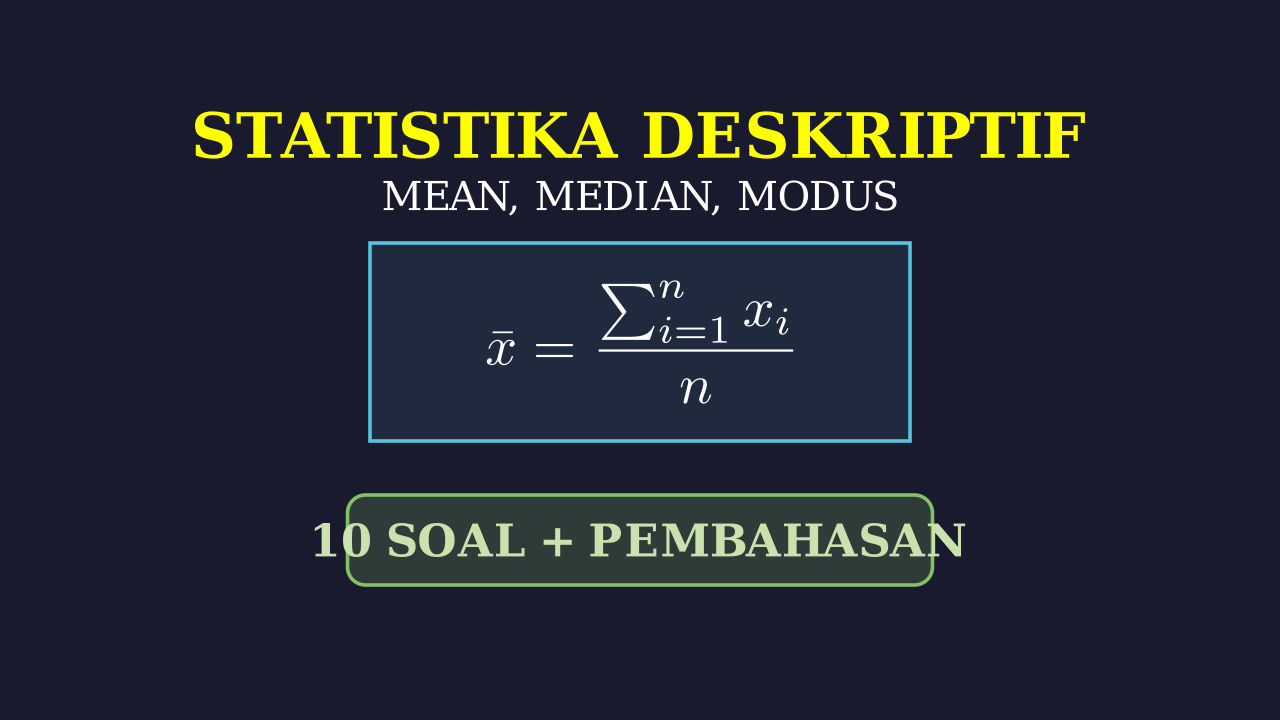
Measures of central tendency include the mean, calculated as the sum of x sub i divided by n; the median, or Q two, which is the middle value; and the mode, the most frequent value.
To measure dispersion, we use the range, which is x max minus x min; variance, or s squared; and the standard deviation, s, which is the square root of the variance.
In our first example with data points four, eight, three, seven, and eight, we first sort them. The mean is thirty divided by five, which equals six, and the median is the middle value, seven.
For frequency data with x values five, six, and seven, we calculate n equals ten. The sum of frequencies times values is sixty-one, giving us a mean of six point one.
In data transformations, if the mean is ten and standard deviation is four, multiplying by three and subtracting five results in a new mean of twenty-five and a new standard deviation of twelve.
Understanding quartiles is easier with a box plot. We visualize the spread using Q one, the median Q two, and Q three across the whiskers and the box.
Avoid common mistakes: always sort data for the median, remember subtraction doesn't affect standard deviation, and don't confuse variance with standard deviation.
To summarize: the mean is the average, the median is the sorted middle, and standard deviation measures spread. Master these rules to ace your UTBK exam!
With these ten examples and detailed concepts, you are ready to tackle any statistics problem. Good luck with your studies!